 One Country, Three Different Economic Maps
India does not have one economic map. It has at least three. The first shows where goods are manufactured. The second shows where income and value are created. The third shows where taxable transactions are recorded. These maps overlap, but they are not identical.
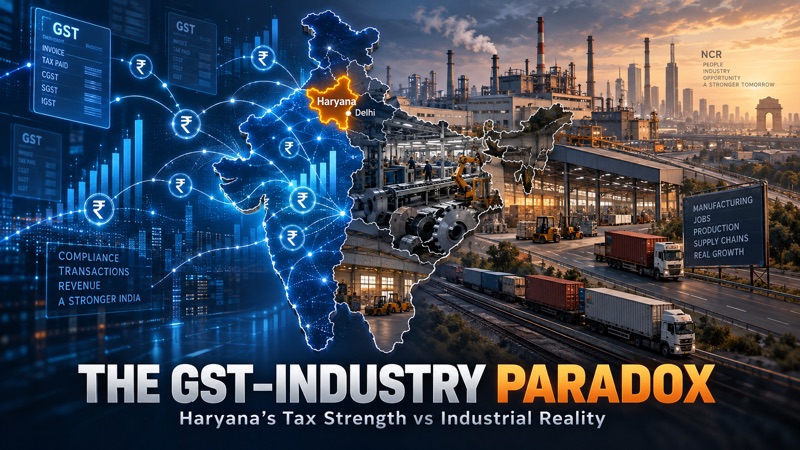
This difference becomes visible when GST collections are compared with industrial production. Maharashtra leads GST collection because it combines manufacturing, finance, corporate headquarters, ports, services and a large consumer market. Gujarat has a far more industry-intensive economy, but its GST share is lower than Maharashtra. Delhi produces relatively little industrial output but collects substantial GST. Haryana contributes only around 3.6 to 3.7 per cent of India’s GDP, yet it generates approximately 7.1 per cent of the domestic GST attributed to states.
The simple conclusion would be that Haryana is producing far more than its economic size suggests. The more accurate conclusion is different. Haryana has become one of India’s densest centres of formal, taxable and corporate economic activity. Its GST strength comes not only from factories, but also from Gurugram’s corporate economy, NCR consumption, automobile trade, warehousing, logistics, real estate and business services.
This is why GST should never be treated as a direct measure of industrialisation.
India’s Top GST States and Their Industrial Reality
During 2024–25, Maharashtra collected approximately ₹3.58 lakh crore in gross GST and contributed more than one-fifth of domestic GST attributed to states. Karnataka followed with around ₹1.59 lakh crore, Gujarat with ₹1.36 lakh crore, Tamil Nadu with ₹1.31 lakh crore and Haryana with ₹1.19 lakh crore. Uttar Pradesh, Delhi, West Bengal, Telangana and Odisha completed the leading group.
But their industrial structures are sharply different.
Industry contributes around 42 to 43 per cent of Gujarat’s state value added. In Odisha, the proportion is also above 43 per cent because mining, metals, power and large mineral-based industries dominate the economy. Tamil Nadu has a more diversified industrial structure, with industry contributing roughly one-third of its state value added. Maharashtra’s industrial share is only around one-fourth, yet it leads India in GST because it combines industrial production with finance, services, imports, consumption and corporate transactions.
Delhi represents the opposite extreme. Industry has a relatively small presence in its economy, but the city records high GST because it is a major centre of consumption, trade, distribution, professional services and company registrations.
The comparison reveals a fundamental fact. A state can be highly industrialised without becoming a proportionately large GST collector. It can also generate high GST without being a major industrial producer.
The Haryana Puzzle
Haryana is perhaps the most important case in this comparison.
Industry accounted for approximately 29.2 per cent of Haryana’s Gross State Value Added in 2023–24. Manufacturing contributed 17.7 per cent, construction 9.2 per cent, electricity and utilities 2.1 per cent, and mining only 0.2 per cent. Services contributed 52.9 per cent, while agriculture and allied activities accounted for 17.9 per cent. (ncaer.org)
Haryana, therefore, is not overwhelmingly industrial in the way Gujarat or Odisha is. Its industrial share is close to the average of Indian states. Yet Haryana collected approximately ₹1,19,362 crore in gross GST during 2024–25 and ranked fifth among all states. Its per-capita GST collection was approximately ₹47,083, the highest among major states. (cdnbbsr.s3waas.gov.in)
The contrast is striking. Haryana contributes approximately 3.6 to 3.7 per cent of India’s GDP, around 4.5 per cent of national industrial output and nearly 7.1 per cent of domestic GST attributed to states.
This is not an accounting accident. It reflects the unusual economic geography of the state.
Gurugram hosts the headquarters, regional offices and service operations of major automobile, technology, consulting, financial, real-estate and consumer companies. Faridabad, Manesar, Gurugram, Sonipat, Panipat, Yamunanagar, Bahadurgarh and other industrial centres add manufacturing depth. The state also benefits from proximity to Delhi, high household incomes, extensive road connectivity and a large formal business base.
Haryana is therefore more than an industrial economy. It is a manufacturing, consumption, logistics and corporate-registration economy operating within the wider National Capital Region.
GST Measures Transactions, Not Factories
The misunderstanding begins with the assumption that high GST collection must mean high production. GST is a destination-based tax. It broadly follows consumption and taxable transactions rather than the physical location of production.
A factory may manufacture a product in one state, but the final tax revenue can move towards the state where that product is consumed. Similarly, a corporate office, warehouse, service centre or large distributor can generate substantial GST without owning a large manufacturing plant.
GST collection is also influenced by formalisation. Two states may have similar levels of economic activity, but the state with better invoicing, stronger compliance, more organised retail and a larger registered business base may report much higher GST.
This creates an invisible divide between the formal economy and the productive economy. GST sees the part of economic activity that enters the tax network. It does not fully capture informal manufacturing, household enterprises, agricultural activity, exempt goods or the real technological quality of production.
A state can therefore collect high GST while having weak manufacturing capability. Another can produce large quantities of industrial goods but collect less GST because much of the final consumption occurs elsewhere.
The Historical Change from Production Centres to Transaction Centres
Before economic liberalisation, the industrial importance of a state was largely associated with factories, public enterprises, electricity generation, mining and physical infrastructure. Industrial maps were built around steel plants, textile mills, engineering centres, ports and mineral belts.
The post-1991 economy changed this relationship. Services expanded, supply chains fragmented and corporate functions became geographically separable from production. A factory could be located in one state, its head office in another, its warehouse in a third and its consumers across the country.
GST deepened this transformation after 2017 by creating a national indirect-tax system based largely on destination and invoice trails. It improved transparency and reduced many internal tax barriers, but it also made state-level GST collection a hybrid indicator. It now reflects consumption, formalisation, corporate organisation, logistics and services alongside production.
The modern economic centre is no longer always the place where machines are installed. It may be the place where orders are processed, invoices are raised, services are supplied, goods are distributed and final consumption takes place.
Why Gujarat and Odisha Look Different from Haryana
Gujarat’s industrial strength is rooted in chemicals, petrochemicals, engineering, pharmaceuticals, automobiles, textiles, ceramics, ports and energy-intensive production. Its industrial share is very high, and its contribution to national industrial output is estimated to be around 14 per cent.
Odisha’s economy is even more industry-intensive in proportional terms, but much of its industrial base is concentrated in mining, metals and capital-intensive production. These sectors can generate enormous output without producing an equally large number of taxable retail transactions or jobs.
Haryana’s industrial share is lower, but its economy produces more transactions per unit of output. Its location beside Delhi, high-income consumers, formal enterprises and corporate concentration enlarge the GST base.
This means Gujarat may be more industrially deep, Odisha more resource-intensive and Haryana more transaction-intensive. GST alone cannot reveal these differences.
The Danger of Rewarding Collection Instead of Capability
Policy can become distorted when high GST is treated as evidence of successful industrialisation. A state may improve tax administration and consumption without developing technological capability, industrial employment or domestic supply chains.
Similarly, a state with mines, power plants, steel factories and intermediate-goods industries may contribute significantly to national production but appear fiscally weaker because final demand and corporate transactions are recorded elsewhere.
The danger is that governments may begin competing mainly for headquarters, warehouses, commercial registrations and high-income consumption. These activities are valuable, but they cannot substitute for industrial capacity.
Factories create production ecosystems. They support tool rooms, repair services, logistics companies, component manufacturers, testing laboratories and skilled employment. Corporate offices create high-value jobs but often generate fewer backward linkages with local MSMEs. A balanced state economy needs both.
What Haryana Must Do Next
Haryana’s high GST performance is an advantage, but it can also hide structural weaknesses.
The state remains heavily concentrated around the NCR belt. Gurugram and Faridabad account for a disproportionate share of formal economic activity, while several districts remain dependent on agriculture, traditional industries or low-productivity services. This creates a state with world-class corporate zones existing beside regions with limited industrial diversification.
The next phase of Haryana’s development cannot depend only on real estate, automobiles, corporate services and NCR consumption. It must spread industrial capability into secondary cities and existing clusters.
Panipat can move from conventional textiles towards technical textiles, recycling and sustainable processing. Faridabad can deepen precision engineering, machinery and industrial automation. Manesar and Gurugram can expand from automobile assembly and corporate services into electric mobility, electronics, software-integrated manufacturing and advanced components. Sonipat can become stronger in food processing, logistics and consumer manufacturing. Ambala’s scientific-instrument cluster can move towards medical devices and precision technologies. Yamunanagar can modernise its plywood, paper and engineering base.
The objective should not merely be to increase the number of factories. It should be to raise local value addition, technology absorption, supplier capability and industrial wages.
A Better Way to Judge State Performance
States should be evaluated through a combined economic scorecard rather than a single number. GST collection must be read alongside manufacturing GSVA, total industrial output, exports, factory employment, industrial wages, electricity consumption, investment, technological intensity, MSME productivity and regional distribution.
Under such a framework, Maharashtra would emerge as India’s broadest economic platform. Gujarat would stand out for industrial depth. Tamil Nadu would be recognised for diversified manufacturing and employment. Karnataka would lead in high-value services and technology-linked production. Odisha would appear strong in resource-based industry but weaker in diversification. Haryana would emerge as a compact, formal and transaction-dense economy with substantial but geographically concentrated industrial capacity.
Such a comparison would be more honest than simply ranking states by GST.
The Future Economic Map
The states that dominate GST today may not automatically dominate industrial production tomorrow. The future will be shaped by electronics, semiconductors, electric mobility, renewable-energy equipment, advanced materials, defence production, biotechnology, data infrastructure and automated manufacturing.
These industries will create new production centres, but the resulting GST may still flow disproportionately towards consumption markets, corporate centres and logistics gateways. The gap between the place of production and the place of taxation could widen further.
The central lesson is simple but important. GST tells us where formal taxable transactions are concentrated. Industrial production tells us where productive capability exists. GDP tells us where economic value is generated. None of these indicators can independently describe the full economic strength of a state.
Haryana demonstrates this new economic reality clearly. Its share in national GST is much higher than its share in GDP and industrial output. This reflects a genuine strength in formalisation, income, consumption, logistics and corporate activity. But it should not be mistaken for complete industrial transformation.
The real test for Haryana is whether it can convert its exceptional tax and transaction base into deeper manufacturing, stronger MSME clusters, wider regional development and more productive employment. High GST collection is an achievement. Turning that fiscal strength into broad industrial capability will be the much larger achievement.
#GST #Haryana #IndustrialDevelopment #Manufacturing #MSME #StateEconomy #EconomicPolicy #ClusterDevelopment #IndiaEconomy





No comments:
Post a Comment